Navigation & timeframes
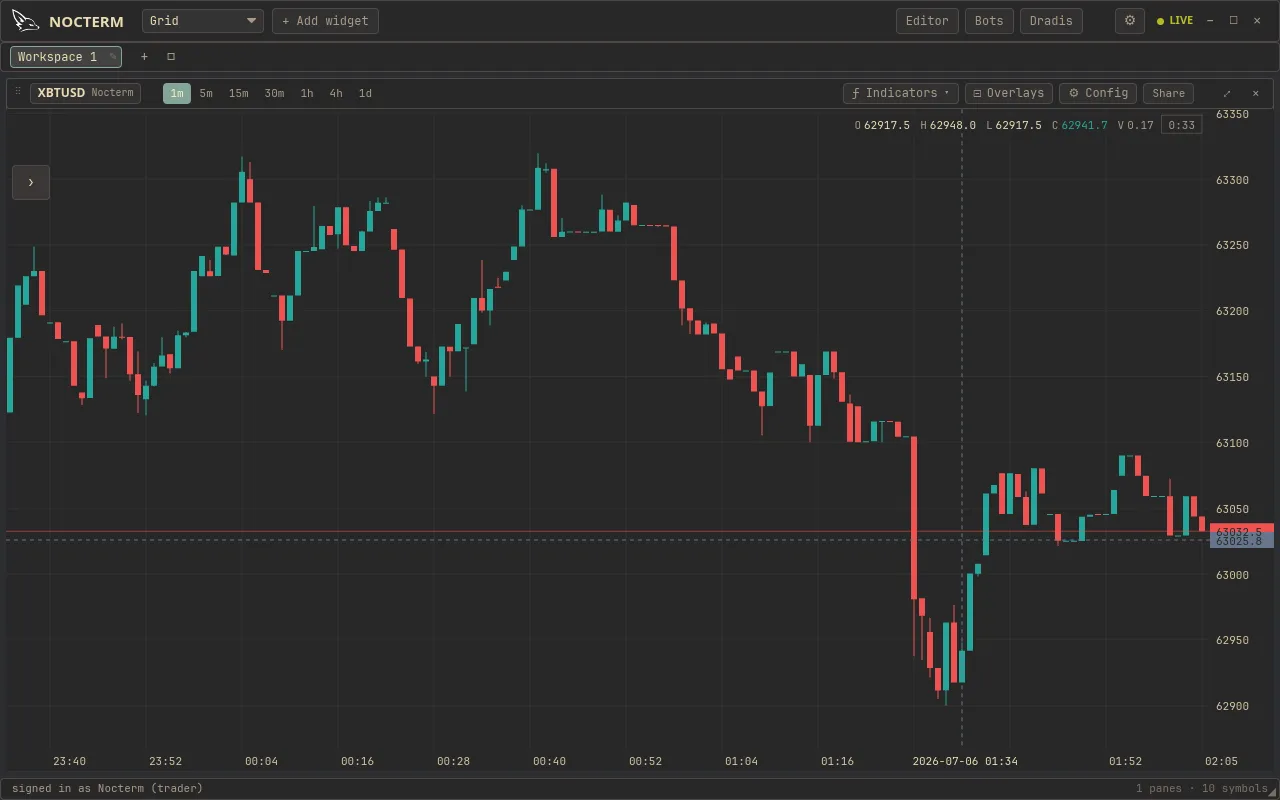
Moving around the chart is direct: scroll to pan, mouse wheel to zoom. The chart keeps itself pinned to the latest bar and auto-scrolls as new data arrives - until you pan away to study history, at which point it holds your view. Eight timeframes from 1m to 1d are available for any symbol on your tracked watchlist.
Overview
Section titled “Overview”The chart follows live price by default, sliding left as each new bar prints so the most recent action stays in view. Pan back into history and that follow mode releases, so you can inspect older bars without being yanked forward. Scroll back to the right edge to re-engage auto-scroll. Zooming with the wheel changes how many bars fit on screen without changing the timeframe.
How to use
Section titled “How to use”-
Pan by scrolling horizontally - drag the visible range left to see older bars, right to return to the present.
-
Zoom with the mouse wheel - in to focus on recent bars, out to see more history at once.
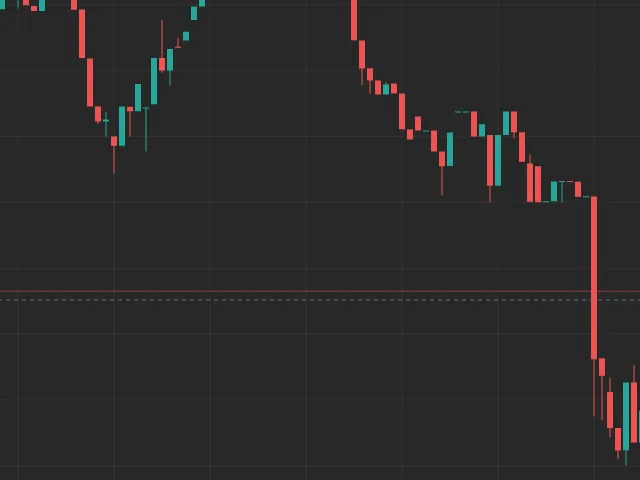
Zooming the chart with the mouse wheel to fit more or fewer bars -
Switch timeframe from the selector in the panel toolbar. The chart redraws at the new interval, keeping you near the latest bar.
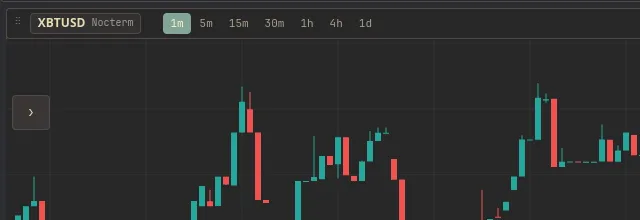
The timeframe selector showing the eight available intervals
Timeframes
Section titled “Timeframes”| Group | Intervals |
|---|---|
| Minutes | 1m, 5m, 10m, 15m, 30m |
| Hours | 1h, 4h |
| Days | 1d |
Related
Section titled “Related”- Chart types - time, tick, and volume candles.
- Drawing tools - annotate the levels you find while panning.
- Volume profile - read volume over the session or the visible range.