Adding & managing indicators
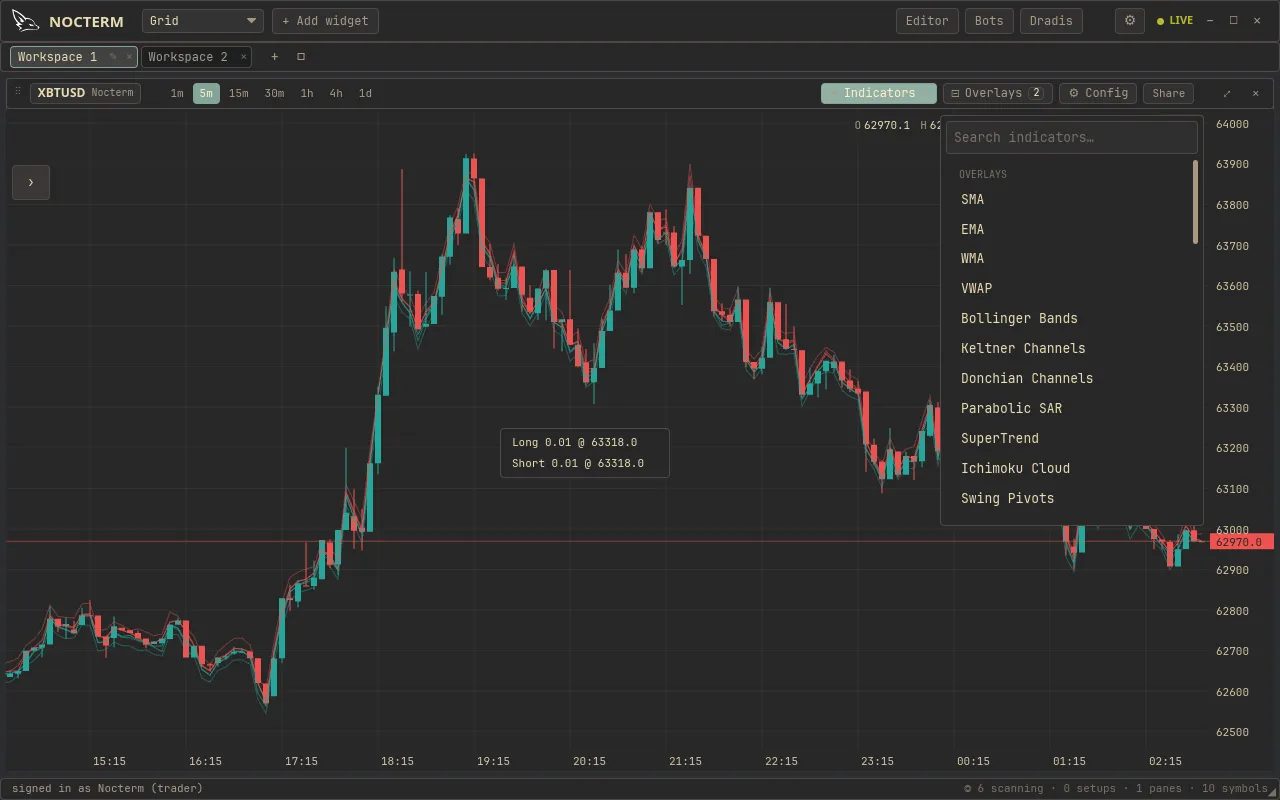
Add technical indicators from a searchable menu split into two groups: Overlays that draw on the price chart, and Oscillators that draw in their own pane below it. Each added indicator gets a legend chip with a settings gear and a remove button, so tuning and clearing are one click away. Indicators are saved per panel.
Overview
Section titled “Overview”The indicator menu is searchable and divided by where each indicator renders. Overlays - moving averages, bands, trend tools - sit directly on the candles. Oscillators - momentum and volume measures - render in a separate pane stacked beneath the chart, on their own scale. Once added, an indicator shows a legend chip: click the gear to change its parameters, click remove to take it off. Your set is remembered per panel, so each chart panel keeps its own indicators.
How to use
Section titled “How to use”-
Open the Indicators menu and search for an indicator by name.
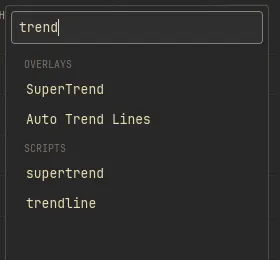
Searching the indicators menu -
Add it. Overlays appear on the price chart; Oscillators open a new pane below.
-
Tune it from its legend chip - click the settings gear to adjust parameters.

A legend chip with its settings gear and remove button -
Remove an indicator with the remove button on its chip.
Indicator groups
Section titled “Indicator groups”| Group | Renders | Examples |
|---|---|---|
| Overlays | On the price chart | SMA, EMA, Bollinger Bands, Ichimoku |
| Oscillators | In a separate pane below | RSI, MACD, Stochastic, ADX/DMI |
Related
Section titled “Related”- Overlays reference - the 10 on-chart overlays and their parameters.
- Oscillators reference - the 10 pane oscillators and their parameters.
- Chart colors & themes - recolor indicator lines.