Custom indicators (Lua)
Beyond the built-in overlays and oscillators, you can write your own indicators in Lua (Luau). Scripts run per-bar — once for each candle — with a small, batteries-included API for plotting lines, histograms, bands, shapes, and buy/sell markers. The editor gives you tabs, syntax highlighting, a live preview chart, tunable inputs, and a debug log.
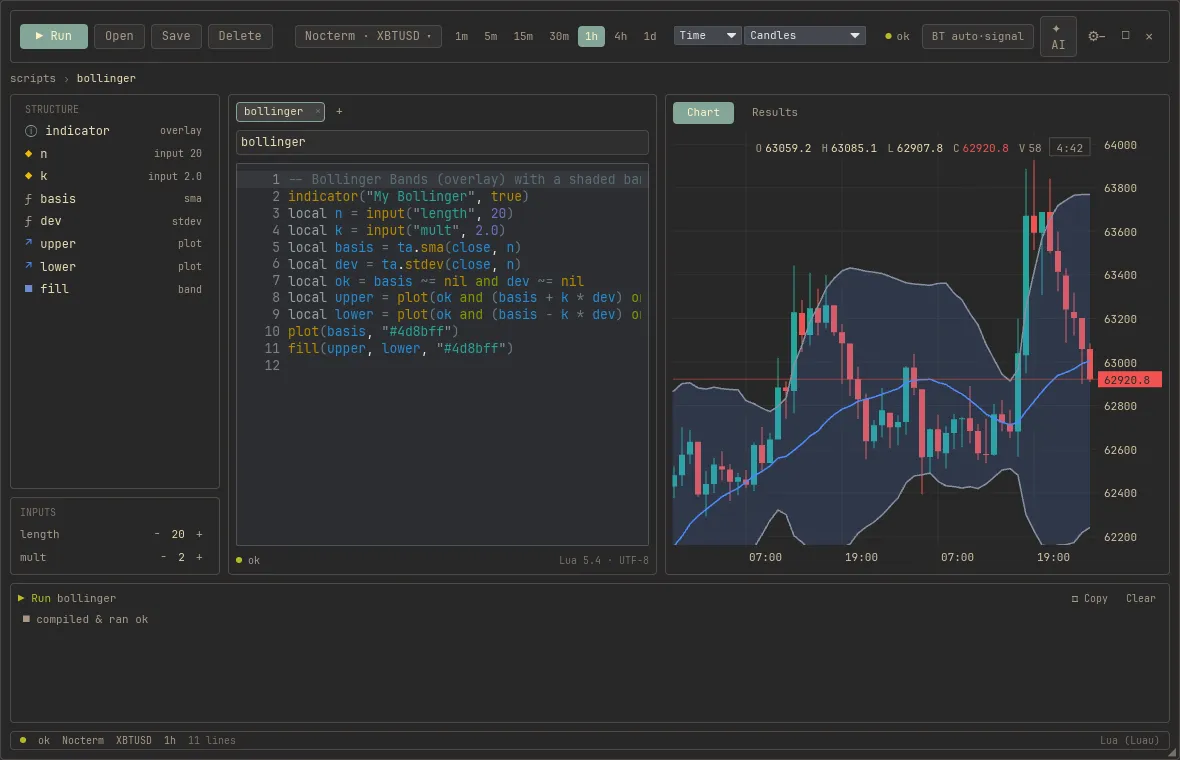
The editor
Section titled “The editor”Open it from the top bar’s Editor button. It’s a two-pane window:
- Left — a code editor with line numbers, Lua syntax highlighting, and tabs (open several scripts at once). The toolbar has Open, Save, Delete, and Run.
- Right — a live preview chart (pick any symbol/timeframe) where your indicator renders, a row of input steppers to tune parameters, and a debug log.
Editing is manual-compile: press Run (or Cmd/Ctrl+Enter) to compile and render. Shortcuts: Cmd/Ctrl+S save, Cmd/Ctrl+T new tab, Cmd/Ctrl+W close tab. A compile or runtime error highlights the offending line in red and prints the message to the debug log.
Saved scripts are .lua files under <config>/nocterm/scripts/ (one folder per type —
indicators, signalers, bots, screeners, orders; the script() declaration routes
them). Once saved, your indicator appears in the chart’s Indicators ▸ Scripts section
like any built-in.
One language, five script types
Section titled “One language, five script types”Every script starts with script(name, type) — the type decides what the script is and
where it shows up:
| Type | What it does | Where it appears |
|---|---|---|
"indicator" | Plots on the chart | Chart ▸ Indicators ▸ Scripts |
"signaler" | Sets a desired net position via signal() — backtestable | Chart pickers + the editor’s Results tab |
"bot" | Trades live via bot.buy / bot.sell | The Bots dashboard |
"scanner" | Emits col() columns per symbol | The Screener widget (+ the editor’s Scan tab) |
"order" | A programmable order type — works a parent order via quote{} | The ticket’s Algo mode (+ the editor’s Sim tab) |
The rest of this page covers indicators; the shared language (inputs, ta.*, state,
plotting) is the same everywhere.
A minimal indicator
Section titled “A minimal indicator”script("My SMA", "indicator") -- name + type (overlay by default)local length = input("length", 20) -- a tunable input (default 20)plot(ta.sma(close, length), "#4d8bff")That’s a complete overlay: it declares itself, takes one input, and plots a 20-period SMA.
Execution model
Section titled “Execution model”Your script runs once per bar, oldest to newest. Two consequences:
statepersists across bars (it resets at the start of each run). Use it for bar-recursive logic (SuperTrend, pivots, counters).ta.*calls keep rolling state keyed by call order, so call them every bar, in the same order — never inside anif/loop that might skip them. Compute the value unconditionally, then branch on it.
-- Right: ta.* called every bar, branch on the resultlocal r = ta.rsi(close, 14)if not na(r) and r > 70 then ... end
-- Wrong: conditional ta.* scrambles its rolling stateif close > open then local r = ta.rsi(close, 14) end
Placement & inputs
Section titled “Placement & inputs”| Call | Purpose |
|---|---|
script(name, type, opts?) | The required first line: display name + type (see above). opts = {overlay=false} puts an indicator in its own pane below the chart (default true = on the price chart). |
input(name, default) | Declare a tunable number; returns its current value. Appears as a stepper in the preview and in the indicator’s settings on a chart. |
Bar globals
Section titled “Bar globals”Set fresh each bar:
| Global | Meaning |
|---|---|
open high low close volume | The current bar’s OHLCV |
hl2 hlc3 | (high+low)/2, (high+low+close)/3 |
close1 | The previous close (nil on the first bar) |
time | The bar’s open time, seconds since epoch — math.floor(time / 86400) anchors UTC days |
bar_index | 0-based index of the current bar |
bar_count | Total number of bars |
time follows the script’s clock. In bar-driven scripts — indicators, signalers, bots,
scanners — it is the current bar’s open time. Order scripts
run on ticks rather than bars, so there time is the current tick’s time: the wall clock
live, the replayed candle clock in the editor’s Sim tab. For another timeframe’s bar times,
use request(tf) and read h.time(n?) (Multiple timeframes).
Helpers
Section titled “Helpers”| Call | Purpose |
|---|---|
nz(x, d?) | x if not nil, else d (default 0) |
na(x) | true if x is nil |
state | A table that persists across bars within a run |
debug(...) / print(...) / log(...) | Write a line to the debug log (debug.log(...) works too) |
alert(message, opts?) | Raise a user alert: toast + Telegram/Discord. Live bar only, once per bar; opts = {id=, cooldown=}. Not in order scripts. |
Persistent storage — store.*
Section titled “Persistent storage — store.*”Key-value data that survives runs and app restarts — for what genuinely can’t
be recomputed from the candles (prefer state for everything else). Values:
numbers, strings, booleans, plain tables. store.set(key, nil) deletes.
| Call | Scope |
|---|---|
store.get(key) / store.set(key, value) / store.del(key) | This instance — auto-namespaced by script + market (+ a persisted per-instance id on charts), so duplicate copies never collide. |
store.shared.get/set/del | All instances of this script. |
store.global.get/set/del | Every script — advisory cross-script data (last write wins). |
Reads see the store as of run start; writes record on the live bar only and
never from the editor preview or backtests (backtests also read an empty store —
guard reads: local n = store.get("n") or 0). Removing a chart indicator and
re-adding it starts a fresh instance bucket; use store.shared for data that
should outlive that.
Plotting
Section titled “Plotting”| Call | Draws |
|---|---|
plot(value, color?) | A line. Returns the output’s index (for fill). nil values leave a gap. |
hist(value, color?) | A histogram column (best in an oscillator pane). Returns its index. |
hline(level) | A horizontal reference line (e.g. RSI 30/70, a MACD zero line). |
fill(idxA, idxB, color?) | A shaded band between two plotted outputs (by index). |
Colors are "#rrggbb" strings; omit for an auto-assigned palette color.
-- Bollinger Bands with a shaded bandscript("Bands", "indicator")local n, k = input("length", 20), input("mult", 2.0)local basis, dev = ta.sma(close, n), ta.stdev(close, n)local ok = not na(basis) and not na(dev)local up = plot(ok and basis + k * dev or nil, "#888fa3")local lo = plot(ok and basis - k * dev or nil, "#888fa3")plot(basis, "#4d8bff")fill(up, lo, "#4d8bff")Shapes & markers
Section titled “Shapes & markers”Drawn in (bar_index, price) space. Shapes accumulate across bars — so a marker on a signal bar
stays put. For a shape you recompute every bar (like a trend line), guard it to the last bar
(if bar_index == bar_count - 1 then ... end) so only the latest is drawn.
| Call | Draws |
|---|---|
line(x1,y1,x2,y2, color?, width?, dashed?) | A segment between two anchors |
ray(x1,y1,x2,y2, color?, width?) | A line that extends past the second anchor |
dot(x,y, radius?, color?) | A filled dot |
tag(x,y, text, color?, above?) | A text badge (above or below the anchor) |
marker(x,y, shape, color?, size?) | A glyph: "arrowup", "arrowdown", "triangleup", "triangledown", "circle", "square", "diamond", "cross" |
-- Green up arrow below the bar on a fast/slow EMA crossif ta.crossover(ta.ema(close, 9), ta.ema(close, 21)) then marker(bar_index, low, "arrowup", "#26a69a") tag(bar_index, low, "BUY", "#26a69a", false)endta.* reference
Section titled “ta.* reference”Call these every bar in a fixed order (see the execution model). Lengths are rounded to whole bars.
Always return a number:
| Call | Returns |
|---|---|
ta.ema(x, n) | Exponential moving average |
ta.rma(x, n) | Wilder’s smoothing (RSI/ATR style) |
ta.atr(n) | Average true range (reads the current bar) |
ta.vwap() | Cumulative volume-weighted average price |
ta.cum(x) | Running cumulative sum |
ta.tr() | True range of the current bar |
May be nil while warming up — guard with na()/nz() before doing math:
| Call | Returns |
|---|---|
ta.sma(x, n) | Simple moving average |
ta.wma(x, n) | Weighted moving average |
ta.stdev(x, n) | Standard deviation |
ta.highest(x, n) / ta.lowest(x, n) | Window high / low |
ta.rsi(x, n) | Relative strength index |
ta.change(x) | x - x[1] |
ta.high(n) ta.low(n) ta.close(n) ta.open(n) | The field n bars back (0 = current) |
Booleans:
| Call | Returns |
|---|---|
ta.crossover(a, b) | true the bar a crosses above b |
ta.crossunder(a, b) | true the bar a crosses below b |
Multiple timeframes
Section titled “Multiple timeframes”request(timeframe) returns a handle to another timeframe’s candles for the same
symbol — so a script on a 5m chart can read 15m or 1h bars, and one on a 15m chart can
read 1m bars. It works in both directions (the host fetches the other timeframe’s data
and injects it before the run).
Call it once near the top (like input), then read fields through the handle:
| Call | Returns |
|---|---|
request(tf) | A handle. tf is "1m","5m","15m","30m","1h","4h","1d". |
h.open(n?) h.high(n?) h.low(n?) h.close(n?) h.volume(n?) h.time(n?) | The field of the n-th most recent closed tf bar at/before the current chart bar (n omitted/0 = the last closed one). |
The accessors are non-repainting — they only ever return bars that have closed by the
current chart bar, so the value steps when a higher-timeframe bar completes. They’re nil
while the timeframe is still warming up (or hasn’t finished loading on the first paint).
-- The last closed 15m close, drawn as a step line on any chartscript("15m close", "indicator")local htf = request("15m")plot(htf.close(), "#f0b90b")-- Higher-timeframe support/resistance: last closed 1h high & lowscript("1h levels", "indicator")local h1 = request("1h")plot(h1.high(0), "#888fa3")plot(h1.low(0), "#888fa3")Backtesting (in progress)
Section titled “Backtesting (in progress)”A script declared script(name, "signaler") is a tradeable strategy: call
signal(size) each bar to set your desired net position. The size is signed, so you
can scale in/out and flip:
| Call | Meaning |
|---|---|
signal(1) | 1 unit long |
signal(2) | scale to 2 units long |
signal(-1) | 1 unit short |
signal(0) | flat (close) |
The position carries forward until you change it, so call signal(...) every bar
from your logic. Open the editor’s Results tab to see the backtest.
Fill model (deliberately un-generous): a position change you decide on a bar fills
at the next bar’s open — no look-ahead, no same-bar fills, no fees or slippage yet.
P&L is per-unit (holding q units through a move of r earns q · r, so size behaves
like leverage). The tearsheet reports realized and unrealized P&L, total return,
max drawdown, Sharpe, exposure, fills, and the open position.
-- EMA-cross strategy: long when fast > slow, flat otherwisescript("EMA cross", "signaler")local fast = ta.ema(close, 9)local slow = ta.ema(close, 21)plot(fast, "#4d8bff")plot(slow, "#f0b90b")if not na(slow) then if fast > slow then signal(1) else signal(0) endendA script with no signal(...) calls simply doesn’t trade — it stays a plain indicator.
Custom setups
Section titled “Custom setups”A custom indicator can double as a setup detector. Enable it under Settings ▸ Custom Setups, and it scans your tracked symbols on every bar close (like the built-in detectors), posting trade setups into the Setups list and chart overlays.
Call setup{...} on the bar your condition triggers:
| Field | Meaning |
|---|---|
direction | "long" or "short" |
entry | trigger price (defaults to the bar’s close) |
stop | protective stop |
target | profit target |
confidence | optional 0..1 score |
label | optional name (defaults to the script() title) |
Each setup is scored by the odds engine (win probability / EV / reward:risk) and passes through your Setup Filters, exactly like a built-in setup. Only setups emitted on the just-closed bar fire, so call it every bar from your logic — it won’t double-post.
-- An RSI-reversal setup: go long when RSI crosses back above 30script("RSI reversal", "indicator", {overlay=false})local r = ta.rsi(close, 14)plot(r, "#4d8bff")hline(30)if not na(r) and ta.crossover(r, 30) then setup({ direction = "long", entry = close, stop = ta.low(1), target = close + 2 * ta.atr(14), label = "RSI<30 reversal", })endOscillator example (MACD)
Section titled “Oscillator example (MACD)”Set overlay = false for a pane below the chart. Histograms anchor to a zero baseline.
script("MACD", "indicator", {overlay=false})local macd = ta.ema(close, 12) - ta.ema(close, 26)local signal = ta.ema(macd, 9)hist(macd - signal, "#888fa3") -- histogramplot(macd, "#4d8bff")plot(signal, "#f0b90b")hline(0) -- zero lineAuto trend line (state + shapes)
Section titled “Auto trend line (state + shapes)”script("Auto Trendline", "indicator")local strength = input("strength", 8)state.piv = state.piv or {}local k = math.floor(strength)local center = ta.high(k) -- candidate pivot high, k bars backif not na(center) then local isPivot = true for j = 0, 2 * k do -- bounded loop is fine local h = ta.high(j) if not na(h) and h > center then isPivot = false break end end if isPivot then state.piv[#state.piv + 1] = { x = bar_index - k, y = center } endendif bar_index == bar_count - 1 then -- draw once, on the last bar local p = state.piv if #p >= 2 then local a, b = p[#p - 1], p[#p] line(a.x, a.y, b.x, b.y, "#ef5350") ray(a.x, a.y, b.x, b.y, "#ef5350") endendSandbox & limits
Section titled “Sandbox & limits”- Scripts run in Luau, a sandboxed Lua — there’s no
io,os,package, or network access.math,string, andtableare available. - A time budget (~250 ms per run) aborts runaway loops, so a bad
whilewon’t freeze the app — it surfaces as a runtime error in the debug log instead. - Errors (compile or runtime) print to the debug log and highlight the offending line in the editor.
- The seeded examples (
sma,supertrend,bollinger,macd,rsi,vwap,trendline, and a guidedtutorial) live in your scripts folder — open them as starting points. The order-script seeds (chaser,twap,scaled_ladder,iceberg,trailing_stop) are covered in Algo orders. - Use the input steppers in the preview to tune parameters live without editing code.
- Use
debug(...)liberally; the values show in the panel under the preview chart.