Market Scanner
The Market Scanner is a grid: your symbols down the rows, timeframes across the columns, and in each cell the strongest active setup. It shows where the action is across your whole universe at once, and lets you jump straight to it.
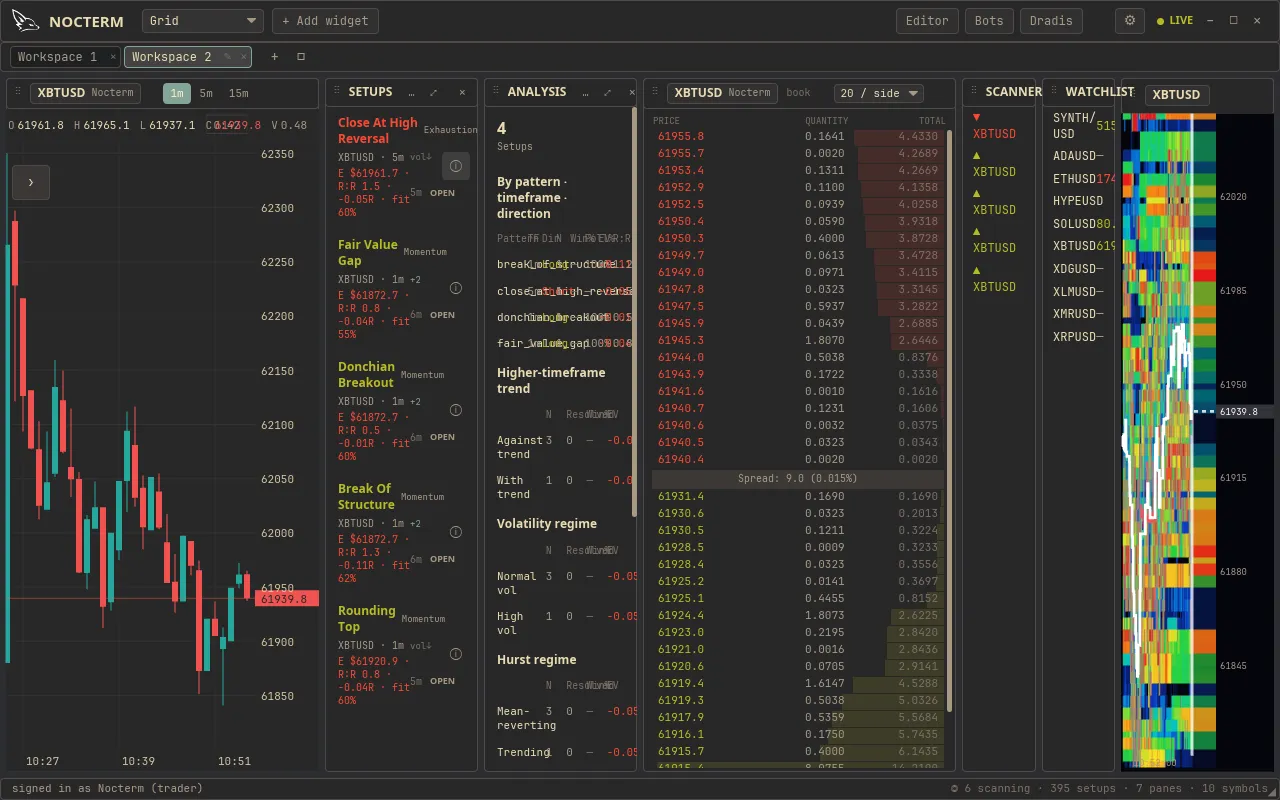
Overview
Section titled “Overview”Each cell summarises the best setup currently firing on that symbol-and-timeframe pair. Cells are tinted green or red by direction, with the intensity scaled to the metric you’re ranking on - so a bright green cell is a strong bullish setup and a deep red one a strong bearish setup. Hover a cell for the details; click it to focus that chart and select the signal.
When you want a wall-sized view, the scanner pops out into its own window.
How to use
Section titled “How to use”-
Open the Scanner panel. The grid fills with the strongest setup per symbol per timeframe.
-
Pick the metric to rank by - EV, win %, confluence, or progress. The cell tints re-scale to the metric you chose.
The rank-by selector - EV, win percent, confluence, progress -
Turn on the alignment filter to show only cells aligned with the higher-timeframe trend, cutting counter-trend noise.
-
Hover a cell for its details, then click to focus that chart and select the signal.
-
Use Pop out to open the grid in its own window for a second monitor.
Ranking metrics
Section titled “Ranking metrics”| Rank by | Highlights cells with |
|---|---|
| EV | The highest expected value, in R |
| Win % | The highest simulated win rate |
| Confluence | The most co-firing patterns stacked together |
| Progress | Setups furthest along toward their target or stop |
Related
Section titled “Related”- Market Screener - rank whole symbols rather than cells.
- Watchlist - live prices for the symbols you track.
- The Active Setups feed - the same setups as a chronological stream.